Rainfall Map around Fukushima Daiichi Nuclear Power Plant (Google Maps Tiling Version)
|
The detail of the wind map is available at detailed information、Twitter accounts at Twitter.
Time Series of Rainfall
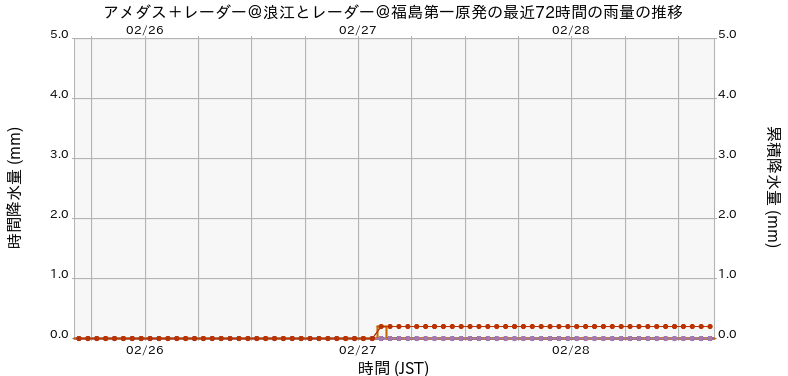
Rainfall in the Last 72 Hours

The graph shows the time series of hourly rainfall and accumulated rainfall, where blue lines represent rainfall at AMeDAS Namie (approximately 10 kilometers from Fukushima Daiichi), purple lines, radar rainfall at AMeDAS Namie, and red lines, radar rainfall at Fukushima Daiichi Nuclear Power Plant. Because the radar rainfall does not represent the observed value, it may contain errors due to many factors. Please use it as a rough reference.
Forecast Rainfall

This graph illustrate hourly and accumulated rainfall around Fukushima Daiichi Nulcear Powre Plant from Meso Model GPV. This forecast is updated every three hours, and forecast rainfall will change frequently. Please check the latest information, and use it as a rough reference.