1. Summary
We have two research challenges for generating images to improve our understanding about information extracted from data in a visual manner. Firstly, we have sceintific visualization, in which we use graphical elements such as color to enhance the presetation of some aspects of phenomena, and this is closely related to computer graphics. Secondly, we have information visualization, in which we convert information to a visual form to understand data whose structure is difficult to understand only looking at numbers and characters such as massive data, and this is closely related to information design. This page introduces topics related to scientific visualization.
2. Visualization of Meteorological Satellite Imagery Using Volume Rendering
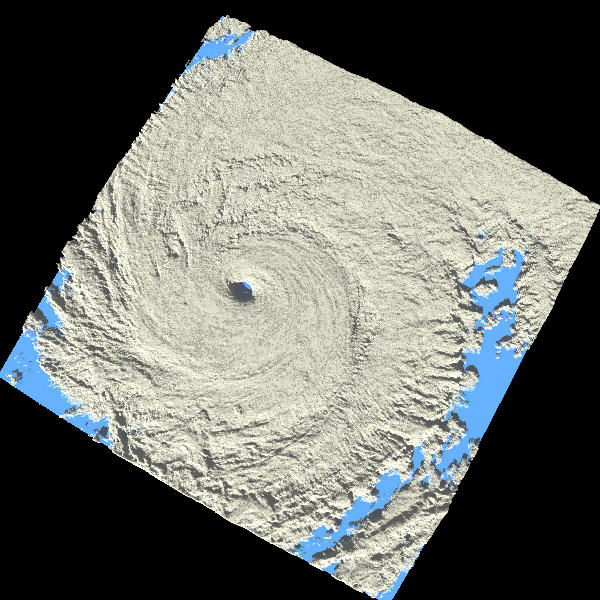
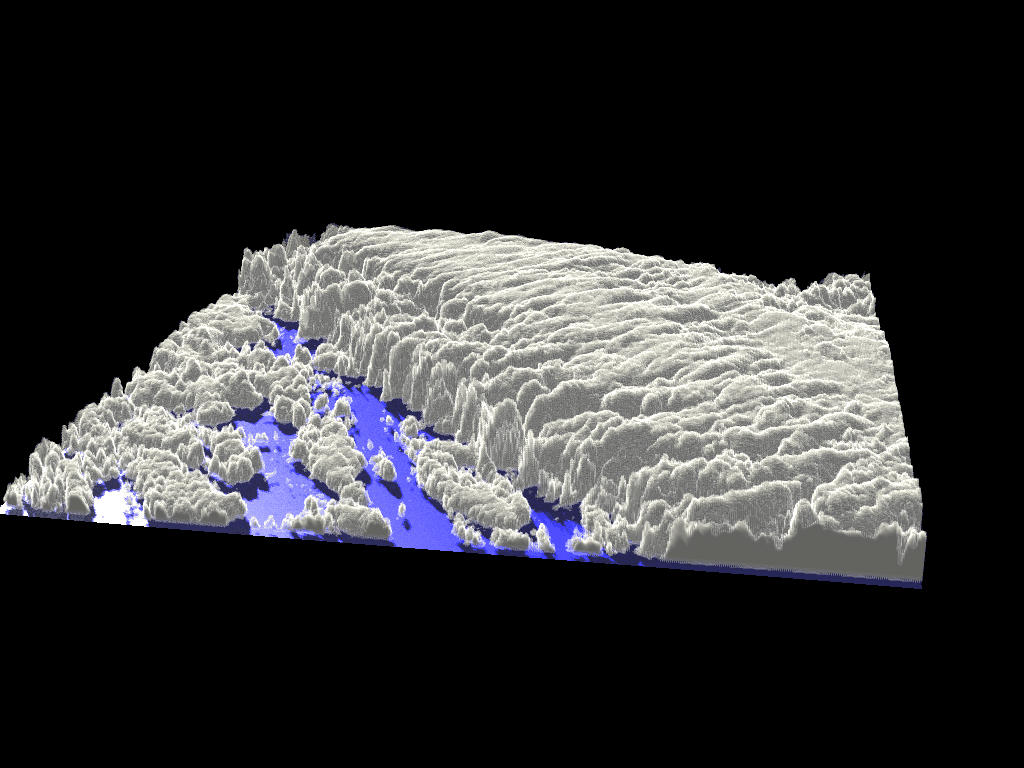
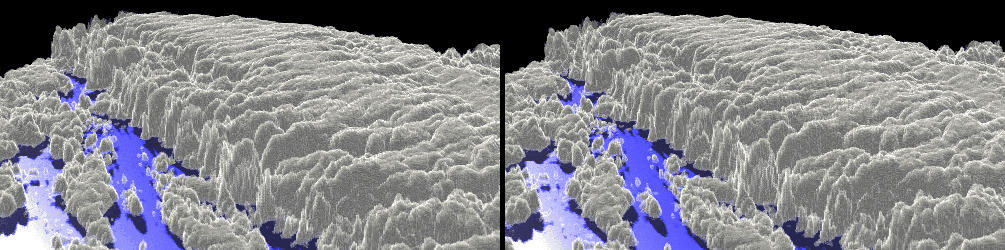
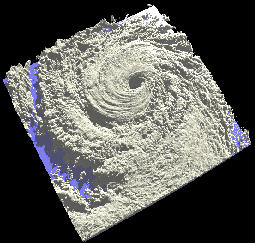 The first example of visualization is to visualize the three-dimensional structure of clouds from meteorological satellite imagery with the aim of obtaining perspective views of satellite images. The advantage of this presentation of images is to reveal the structure of clouds more clearly with fluctuating shading of the cloud surface, and moreover, the time-series presentation of those images gives intuitive understanding on the dynamics of cloud generation.
Background behind this visualization is the fact that an infrared image measures the temperature of the surface, which approximately corresponds to cloud-top temperature. Hence it gives a good estimate on cloud-top height with the help of the vertical profile of the atmosphere. Satellite images can then be converted into three-dimensional volume data, and can be visualized in perspective views by means of volume rendering. The satellite images used in this project is NOAA and GMS (Himawari).
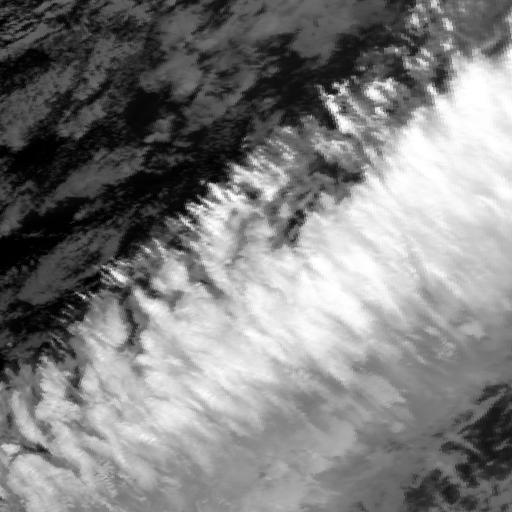
Typhoon 9605 (Jul. 3 - Jul. 9, 1996), GMS Infrared Images
Typhoon 1995 No.12 (Sep. 16, 1995), NOAA Infrared Images
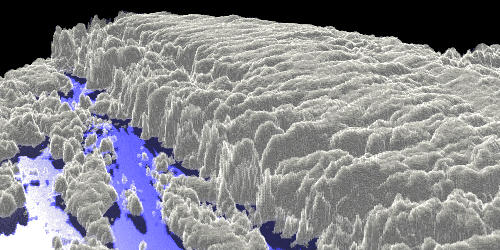
Other Examples, NOAA Infrared Images
3. Related Topics
Fractal
Fractal is an important idea for the visualization of
natural objects and scenes, such as clouds and terrains. If we can
generate cloud images using algorithms associated with fractal,
"analysis by synthesis" approach can be applied to the analysis of
remote sensing cloud images. The background of this page is generated
by Fractional Browninan Motion (FBM), one of the fractal models
associated with clouds.
4. Related Demonstrations
-
Asanobu KITAMOTO, Mikio TAKAGI,
"3D Visualization of Meteorological Satellite Imagery Using Volume Rendering",
Proceedings of the Annual Convention, The Institute of Television Engineers of Japan,
pp. 114-115,
doi:10.11485/tvac.32.0_114,
1996-7 (in Japanese)
[
Abstract
]
[
Paper
]
6.
Related Links
-
NASA's Visible Earth
A searchable directory of images, visualization, and animations of the Earth.
http://visibleearth.nasa.gov/
-
NCAR / Visualizations
The visualization section of National Center for Atmospheric Research (NCAR). Includes the visualization of atmospheric simulations.
http://www.vets.ucar.edu/