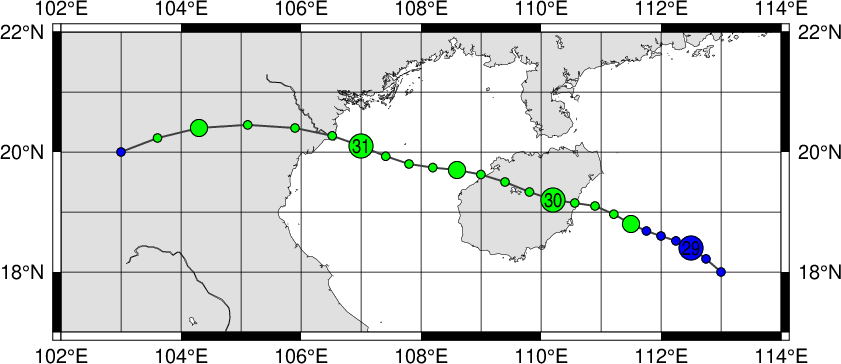
|
Year
|
Month
|
Day
|
Hour
|
Lat.
|
Long.
|
Wind (kt)
|
Gust (kt)
|
Direc. of Major Storm Axis
|
Radius of Major Storm Axis (nm)
|
Radius of Minor Storm Axis (nm)
|
Direc. of Major Gale Axis
|
Radius of Major Gale Axis (nm)
|
Radius of Minor Gale Axis (nm)
|
Image
|
| 2005 |
7 |
28 |
18 |
18.0 |
113.0 |
0 |
0 |
- |
- |
- |
- |
- |
- |
Image |
| 2005 |
7 |
29 |
00 |
18.4 |
112.5 |
0 |
0 |
- |
- |
- |
- |
- |
- |
Image |
| 2005 |
7 |
29 |
06 |
18.6 |
112.0 |
0 |
0 |
- |
- |
- |
- |
- |
- |
Image |
| 2005 |
7 |
29 |
12 |
18.8 |
111.5 |
35 |
0 |
- |
- |
- |
E |
150 |
50 |
Image |
| 2005 |
7 |
29 |
18 |
19.1 |
110.9 |
40 |
0 |
- |
- |
- |
E |
170 |
50 |
Image |
| 2005 |
7 |
30 |
00 |
19.2 |
110.2 |
45 |
0 |
- |
- |
- |
E |
190 |
50 |
Image |
| 2005 |
7 |
30 |
06 |
19.5 |
109.4 |
45 |
0 |
- |
- |
- |
E |
190 |
50 |
Image |
| 2005 |
7 |
30 |
12 |
19.7 |
108.6 |
45 |
0 |
- |
- |
- |
E |
190 |
50 |
Image |
| 2005 |
7 |
30 |
18 |
19.8 |
107.8 |
45 |
0 |
- |
- |
- |
E |
190 |
50 |
Image |
| 2005 |
7 |
31 |
00 |
20.1 |
107.0 |
45 |
0 |
- |
- |
- |
E |
190 |
40 |
Image |
| 2005 |
7 |
31 |
06 |
20.4 |
105.9 |
40 |
0 |
- |
- |
- |
E |
190 |
30 |
Image |
| 2005 |
7 |
31 |
12 |
20.4 |
104.3 |
35 |
0 |
- |
- |
- |
E |
180 |
20 |
Image |
| 2005 |
7 |
31 |
18 |
20.0 |
103.0 |
0 |
0 |
- |
- |
- |
- |
- |
- |
Image |
|

