KITAMOTO Asanobu
@
National Institute of Informatics (NII)
>
Search
|
Site Map
Digital Typhoon: Cyclone 198303 (ELINOR) - General Information (Pressure and Track Charts)
Home
>
Earth
>
Digital Typhoon
|
Help
>
Japanese
< Cyclone 198302
1983 Season
Cyclone 198304 >
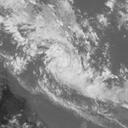
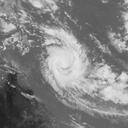
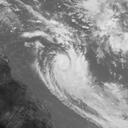
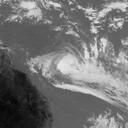
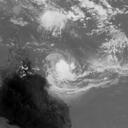
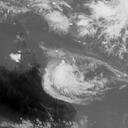
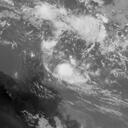
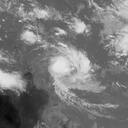
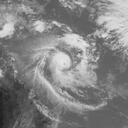
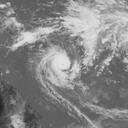
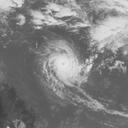
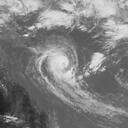
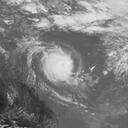
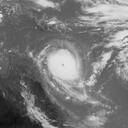
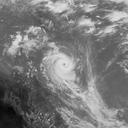
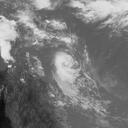
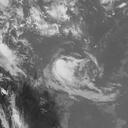
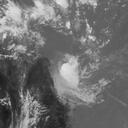
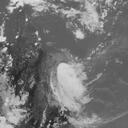
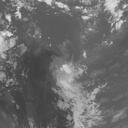
Cyclone 198303 (ELINOR)
Detailed Track Information
Track Information on Google Maps
Detailed Wind Information
List of All Images
||
Resource
Google Earth
GE Animation
Atom Feed
GeoJSON
Best Track Map
Central Pressure Chart (Time Zone = UTC)
Daily Satellite Images
02/13
02/14
02/15
02/16
02/17
02/18
02/19
02/20
02/21
02/22
02/23
02/24
02/25
02/26
02/27
02/28
03/01
03/02
03/03
03/04
Recurrence Plot
Basic Information
Birth
1983-02-13 06:00:00 UTC
Death (Latest)
1983-03-04 06:00:00 UTC
Lifetime
456 (hours) / 19.000 (days)
Minimum Pressure
935 (hPa)
Maximum Wind
110 (knots)
Largest Radius of Storm Wind
0 (nm) / 0 (km)
Largest Diameter of Storm Wind
0 (nm) / 0 (km)
Largest Radius of Gale Wind
0 (nm) / 0 (km)
Largest Diameter of Gale Wind
0 (nm) / 0 (km)
Length of Movement
4457 (km)
Average Speed
9.8 (km/h) | 234 (km/d)
Range of Movement
Latitude 8.0 : Longitude 8.8
Wind Flux
5.1950E+03
Accumulated Cyclone Energy
3.8672E+05
Power Dissipation Index
3.0923E+07
Maximum Pressure Drop
-10 hPa / 06 hours
-18 hPa / 12 hours
-28 hPa / 24 hours
-34 hPa / 48 hours
Data Start
1983-02-10 18:00:00 UTC
Data End
1983-03-04 12:00:00 UTC
Data Duration
522 (hours) / 21.750 (days)
Animation
Best Track
MPEG-2 (6.79 MB)
WMV (5.43 MB)
Satellite Imagery (Constant Illumination)
MPEG-1 (2.05 MB)
MPEG-2 (5.24 MB)
WMV (4.66 MB)
Satellite Imagery (Sun Illumination)
MPEG-1 (1.34 MB)
MPEG-2 (3.58 MB)
WMV (3.18 MB)
Similar Typhoons
Only Track
201111
195908
197905
193804
201907
Top 10 List
Top 50 List
Track and Central Pressure
199304
197205
199402
200615
199712
Top 10 List
Top 50 List
< Cyclone 198302
1983 Season
Cyclone 198304 >
Feature Space Analyzer
Delay Representation
Delay (Hour) :
Principal Component :
:
Help
Expression of Time
Satellite Images (Photographs)
The Intensity and Size of Typhoons - Units of Pressure and Wind
Making Color Images
Typhoon Track Charts
Typhoon Names (Asian Names)
Animation (Movie) of Cloud Motion
Life of a Typhoon - Definition of a Typhoon (Tropical Cyclone), Longevity Typhoons, and Relationship with an Extratropical Cyclone
Similarity-Based Image Search
Typhoon Information - Japan Meteorological Agency (JMA) and U.S. Navy Joint Typhoon Warning Center (JTWC)
Typhoons, Hurricanes and Cyclones
Typhoon Season and Statistics of Formation
The Structure of the Web Site
The Observation of Typhoons and Dvorak Method
Front and Typhoon
About Database
Weather Warnings and Advisories, Weather Forecast, and Typhoon Forecast
Global Warming and Tropical Cyclones (Typhoons, Hurricanes)
Definition of Landfall, Accession and Passage of Typhoons
Storm Tide and Storm Surge
Contact
|
About This Site
|
What's New

(Cyclone 198303)")
:
Cyclone 198303")