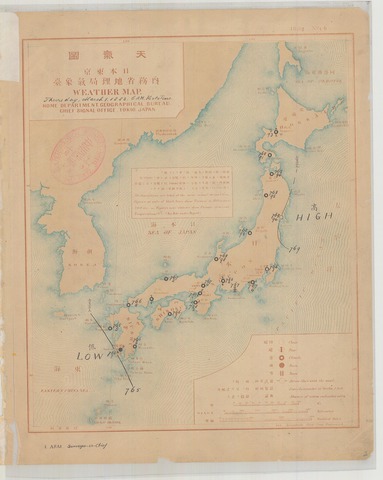
日本で最初の天気図配布(1883年3月1日)
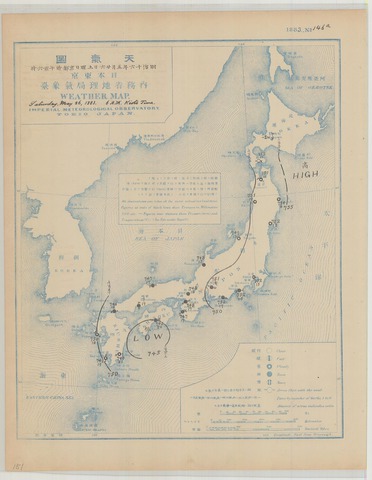
日本初の暴風警報(1883年5月26日)
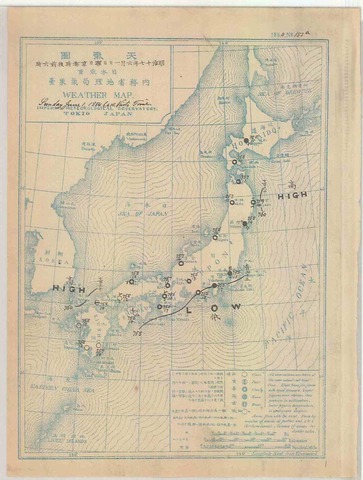
日本初の天気予報(1884年6月1日)
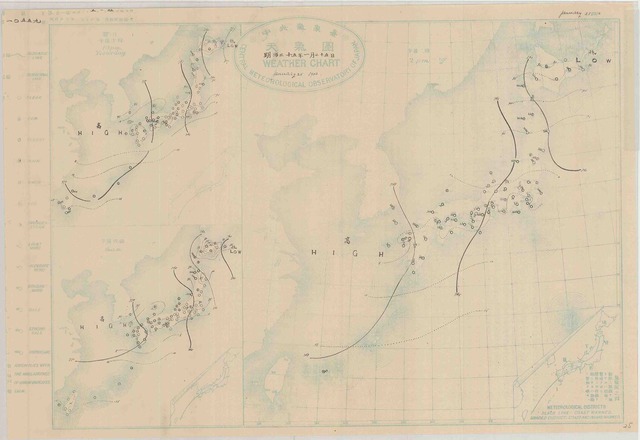
八甲田山系雪中行軍と、旭川で-41度(1902年1月25日)
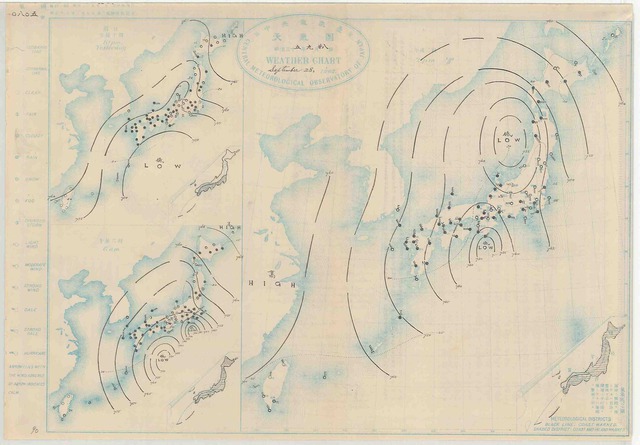
足尾台風(1902年9月28日)
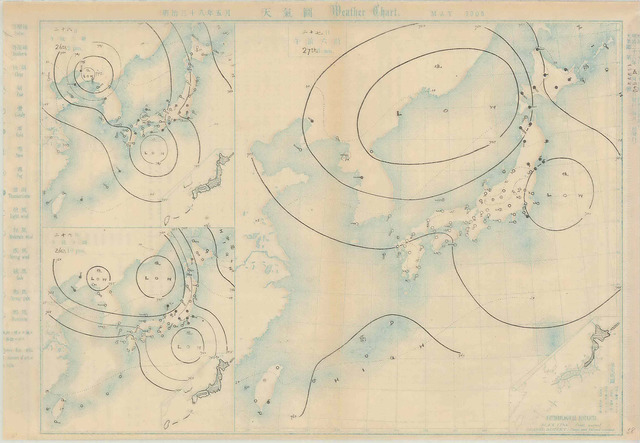
日本海海戦と天気(1905年5月27日)
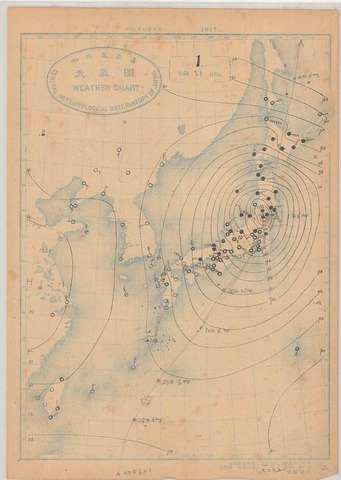
東京の日最低海面気圧(952.7hPa)、東京湾で高潮災害(1917年10月1日)
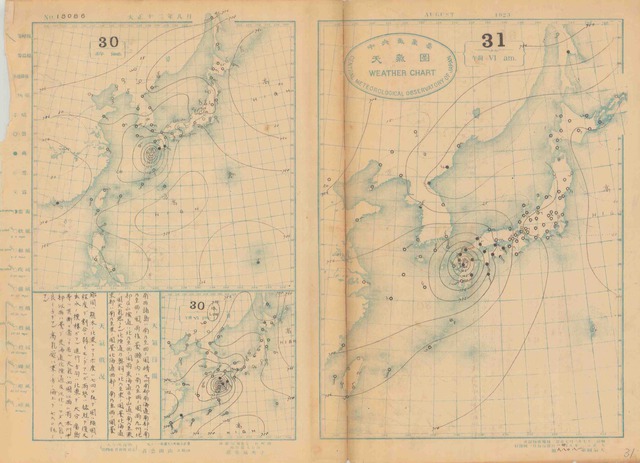
関東大震災と天気(1923年9月1日)
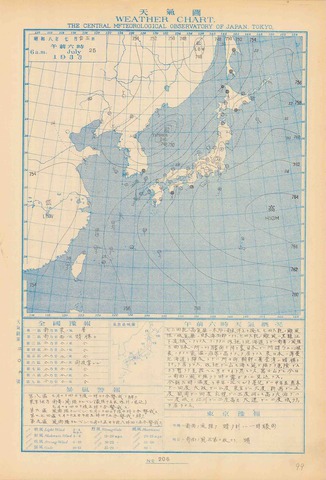
国内初の40度超え(山形)(1933年7月25日)
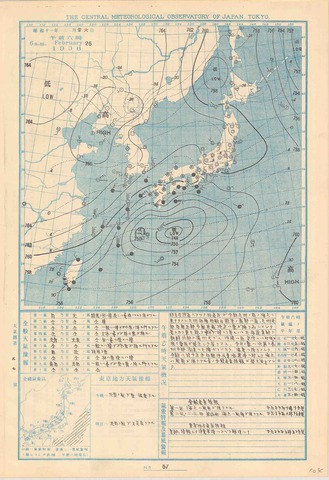
二・二六事件の天気(1936年2月26日)
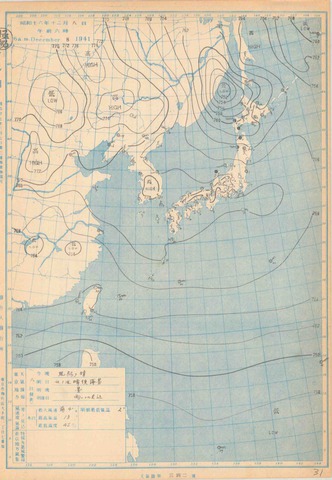
秘密の天気図(1941年12月8日)
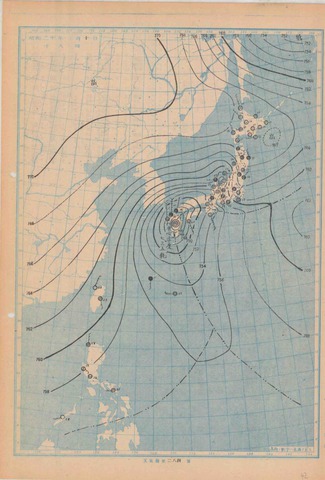
阿久根台風(1945年10月10日)
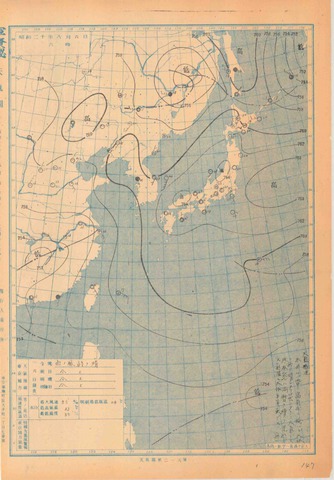
原爆投下と天気(1945年8月6日・1945年8月9日)
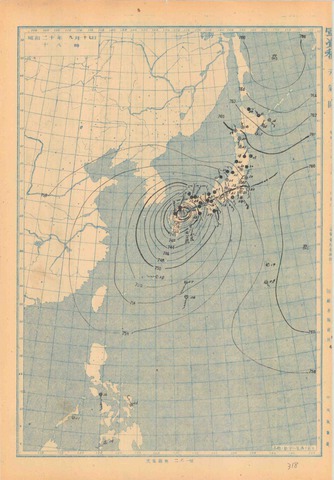
空白の天気図(1945年9月17日)
枕崎台風(1945年9月17日)
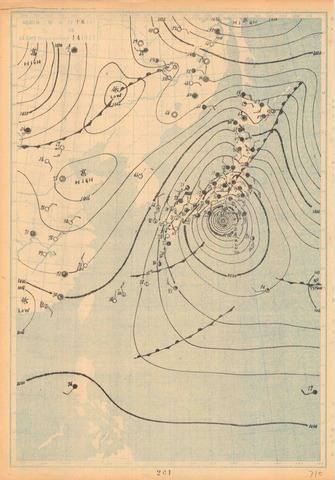
カスリーン台風(1947年9月15日)
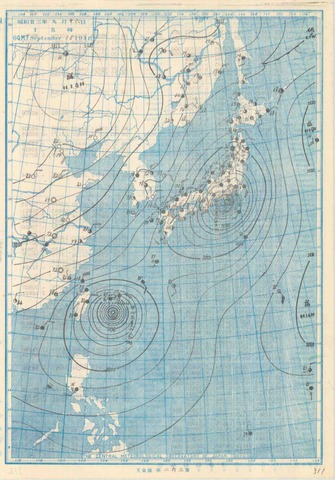
アイオン台風(1948年9月16日)
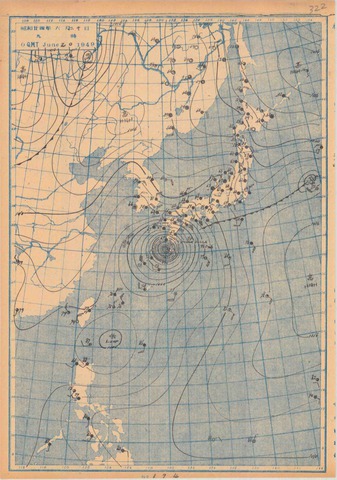
デラ台風(1949年6月20日)
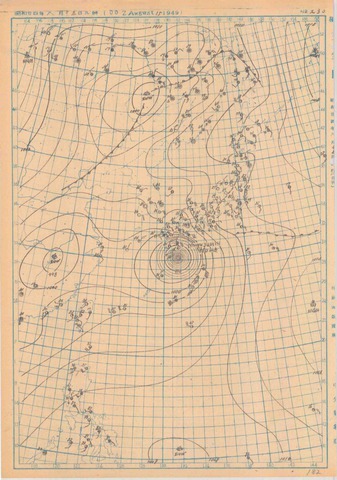
ジュディス台風(1949年8月15日)
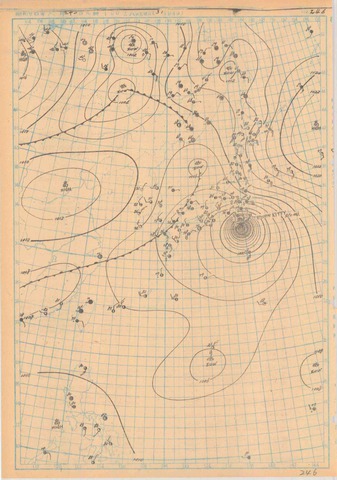
キティ台風(1949年8月31日)
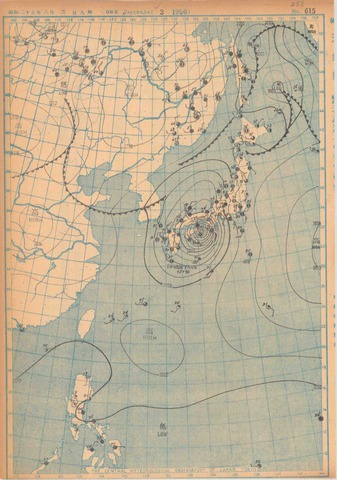
ジェーン台風(1950年9月3日)
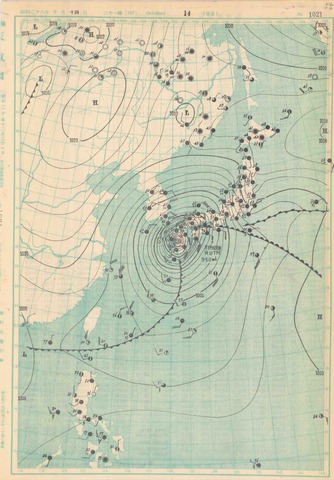
ルース台風(1951年10月14日)
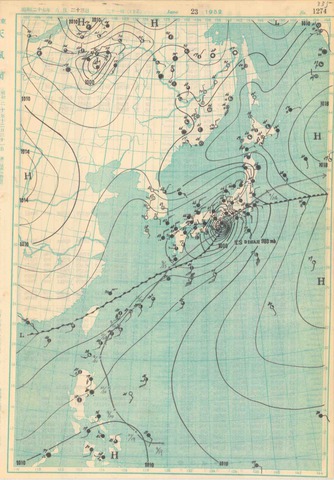
ダイナ台風(1952年6月23日)
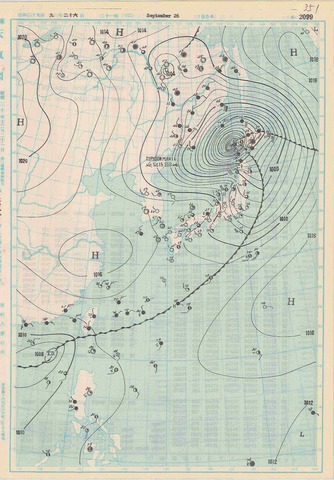
洞爺丸台風(1954年9月26日)
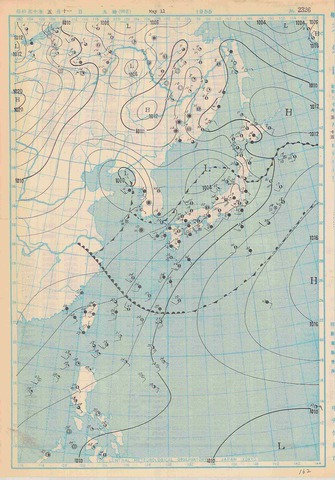
濃霧の中の海難事故(1955年5月11日)
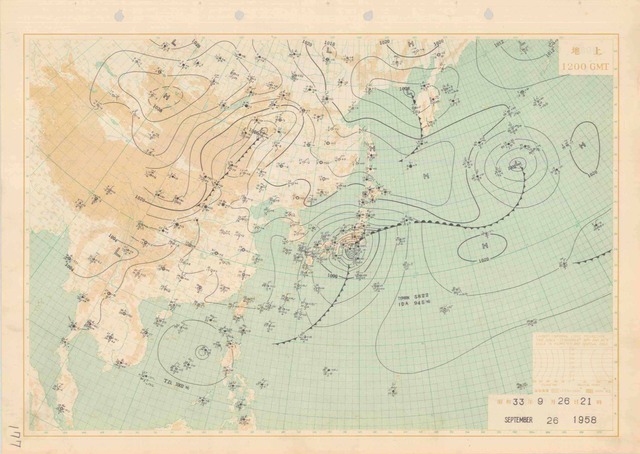
東京の最大日降水量(371.9ミリ)(1958年9月26日)
狩野川台風(1958年9月26日)
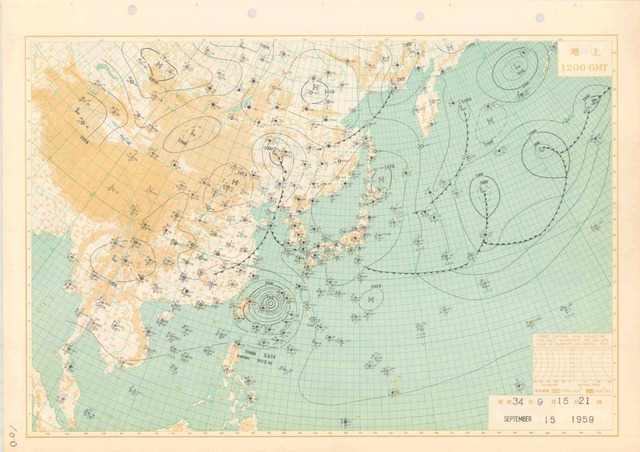
宮古島台風(1959年9月15日)
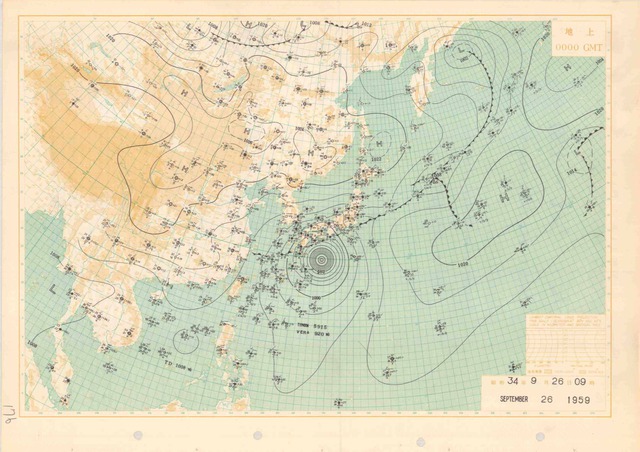
伊勢湾台風(1959年9月26日)
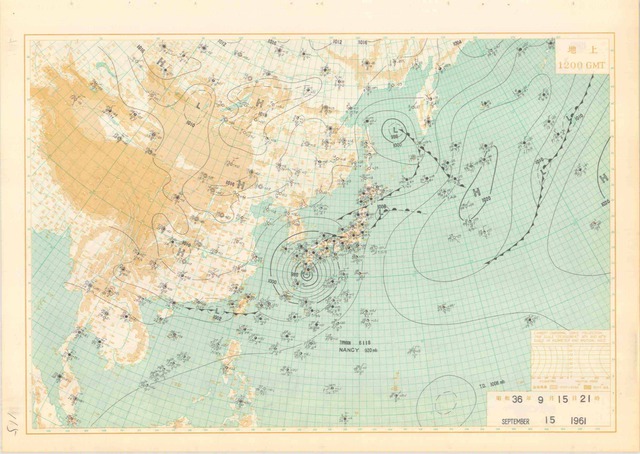
第2室戸台風(1961年9月15日)
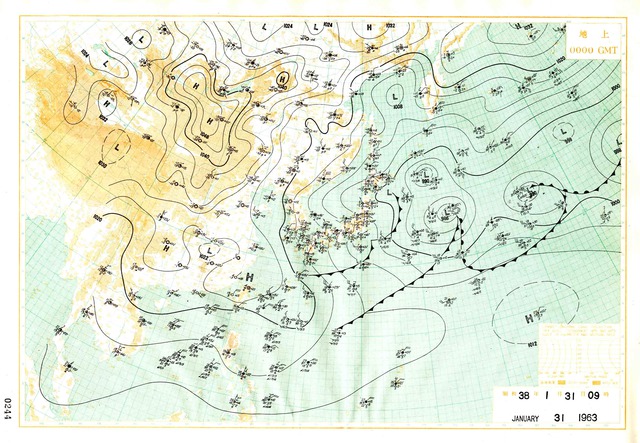
38豪雪(1963年1月31日)
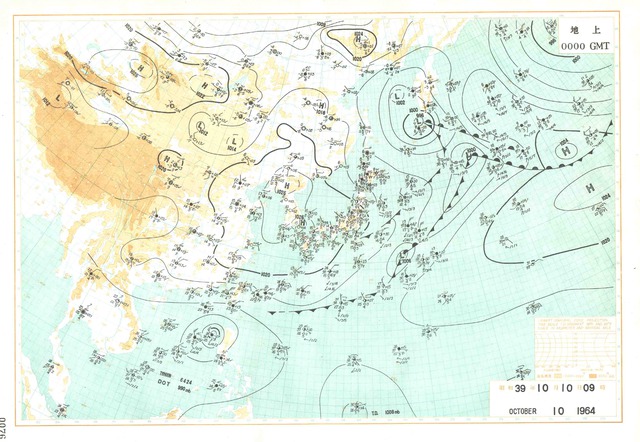
東京オリンピック開幕日の天気(1964年10月10日)
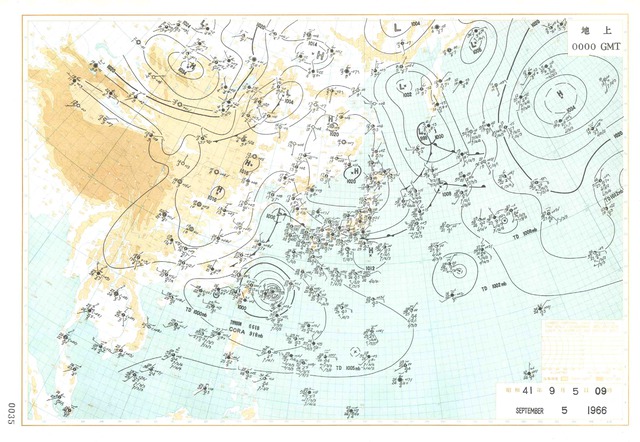
最大瞬間風速 宮古島(沖縄)85.3メートル(1966年9月5日)
第2宮古島台風(1966年9月5日)
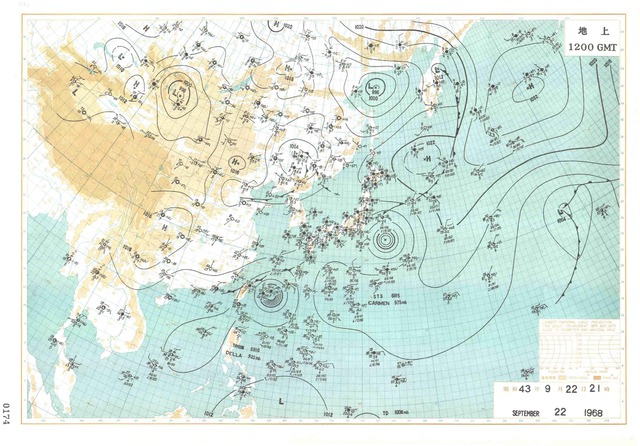
第3宮古島台風(1968年9月22日)
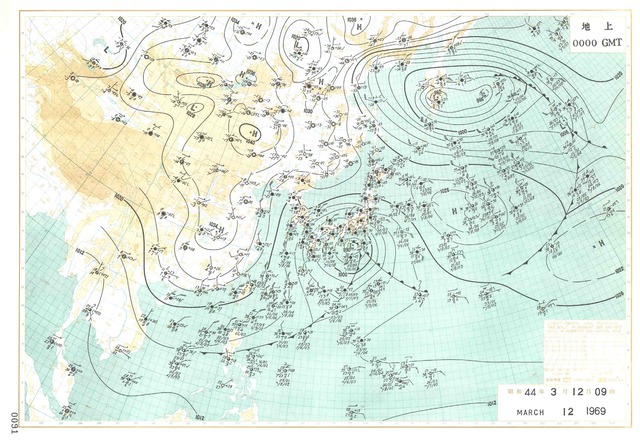
東京の最大日降雪量(33センチ)(1969年3月12日)
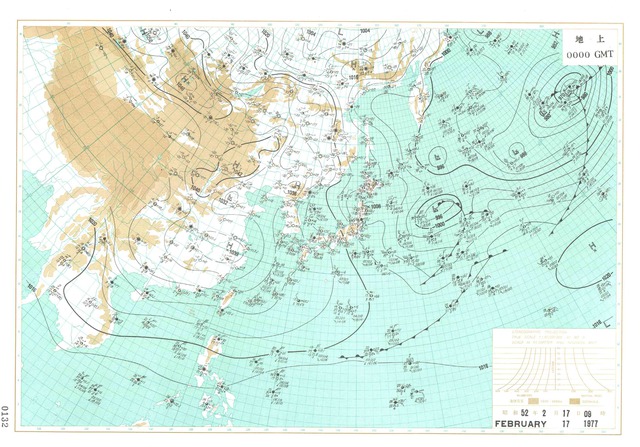
沖縄(久米島)で雪(国内最南端での雪観測)(1977年2月17日)
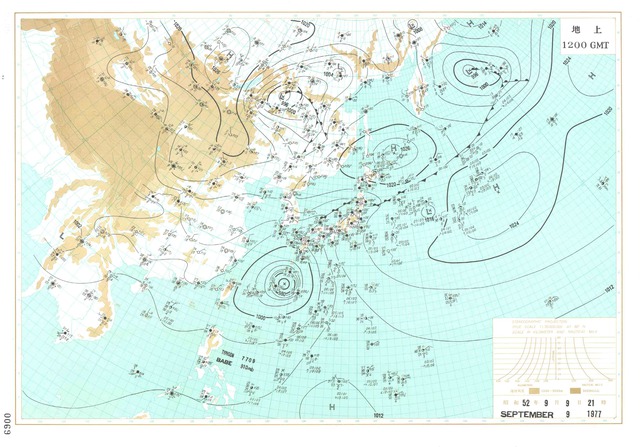
沖永良部台風(1977年9月9日)
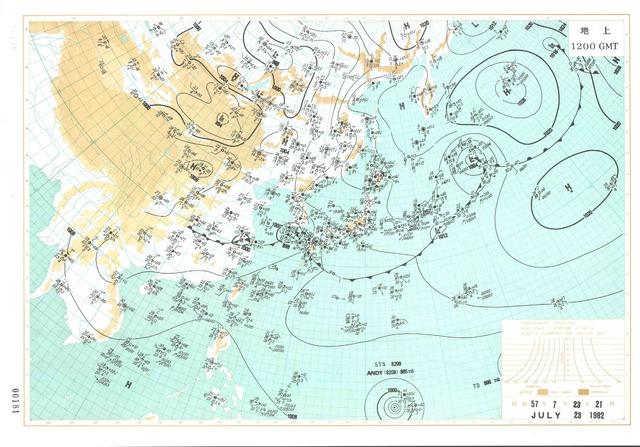
最大1時間降水量 長浦岳(長崎)153ミリ(1982年7月23日)
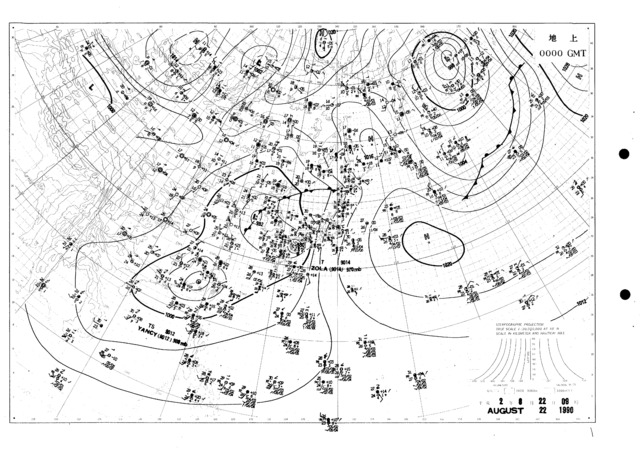
最低気温が30度以上(1990年8月22日)
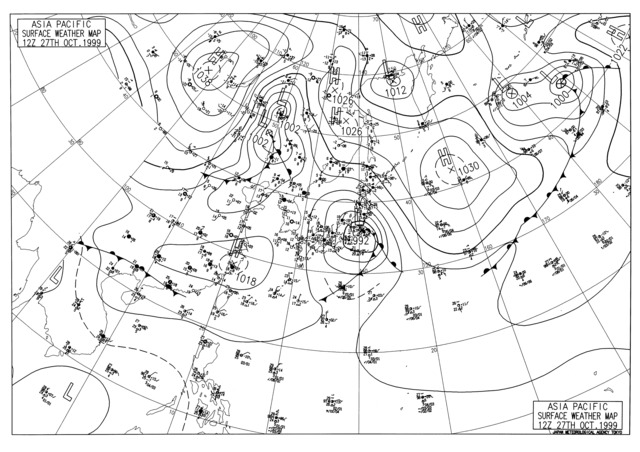
最大1時間降水量 香取(千葉)153ミリ(1999年10月27日)
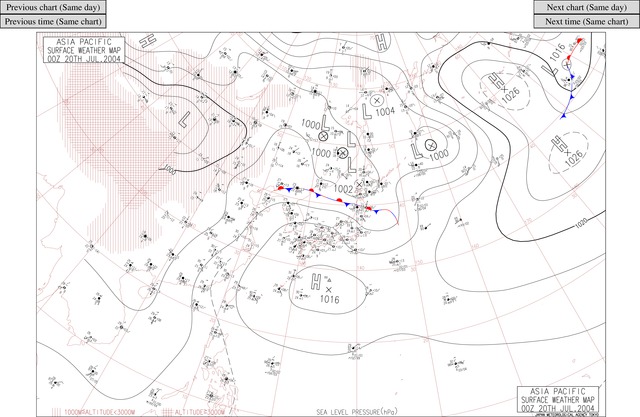
東京の最高気温(39.5度)(2004年7月20日)
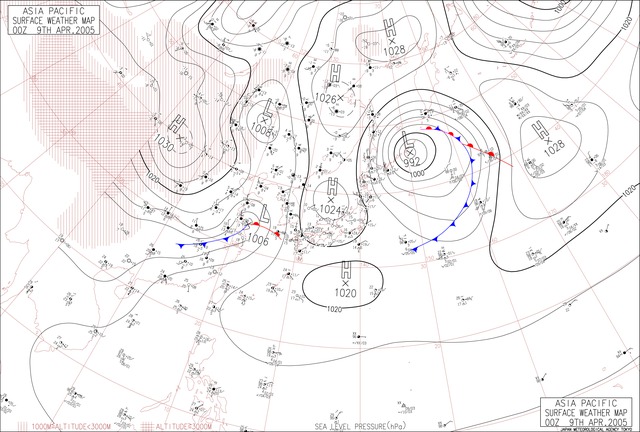
最小湿度 高山(岐阜)0%(2005年4月9日)
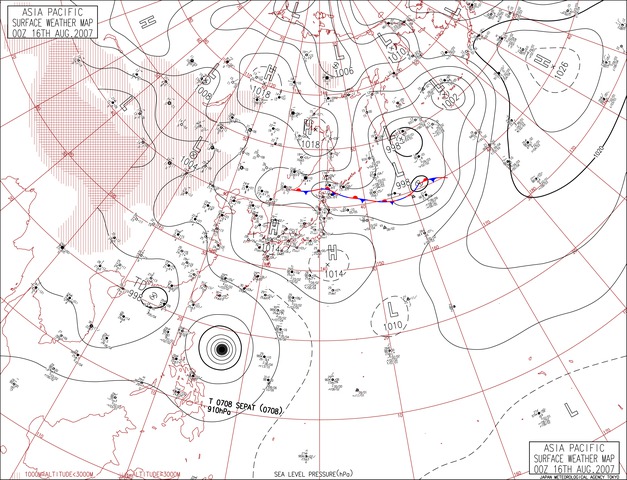
熊谷と多治見で40.9度(2007年8月16日)
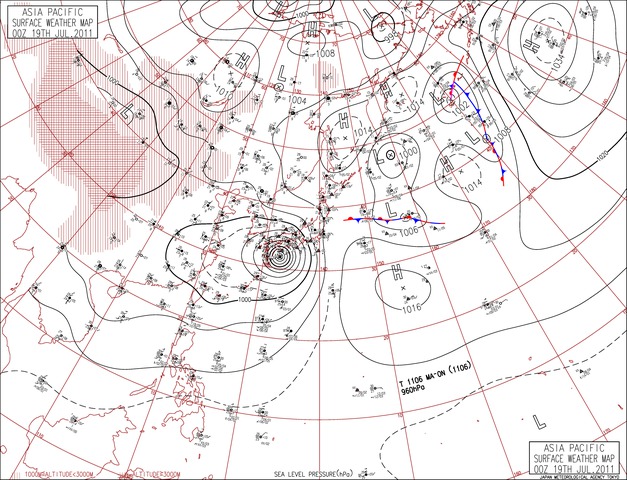
最大日降水量 魚梁瀬(高知)851.5ミリ(2011年7月19日)
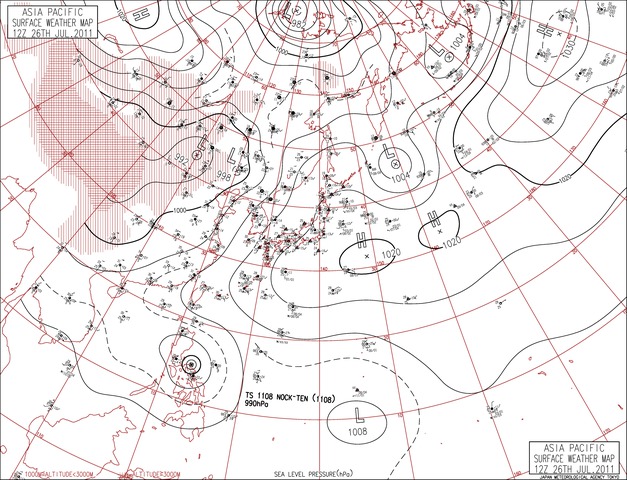
最大10分間降水量 室谷(新潟)50ミリ(2011年7月26日)
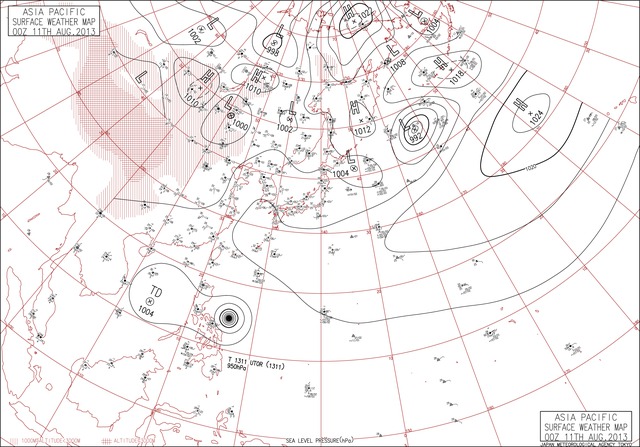
東京で初の最低気温30度以上(30.4度)(2013年8月11日)
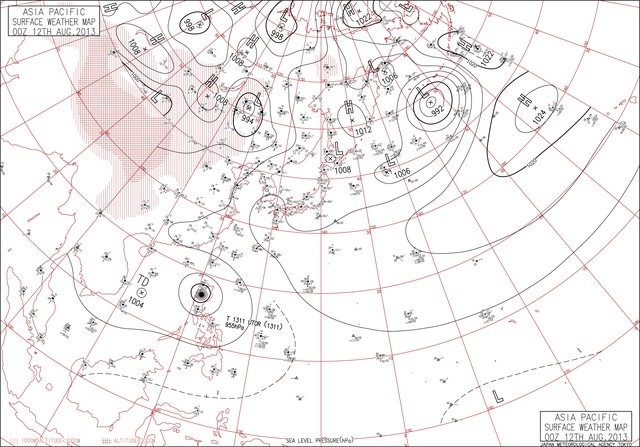
四万十(江川崎)で41度(2013年8月12日)