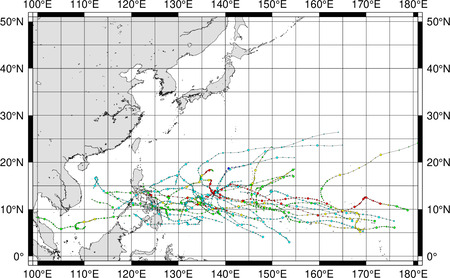
| 1月 |
2月 |
 |
 |
|
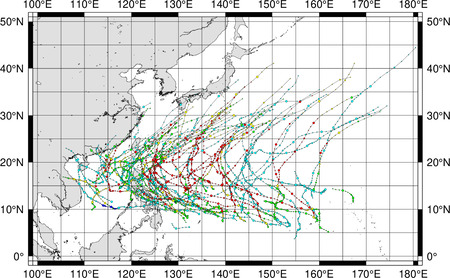
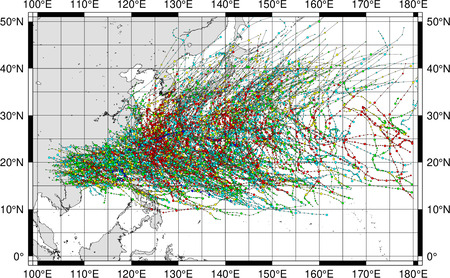
まだ前の年の台風シーズンが続いています。台風は太平洋上を東から西に進み、日本に近づくことはまずありません。
|
一年で最も台風発生数が少ない月です。1951年以来、台風が一つも存在したことのない日もあります。
|
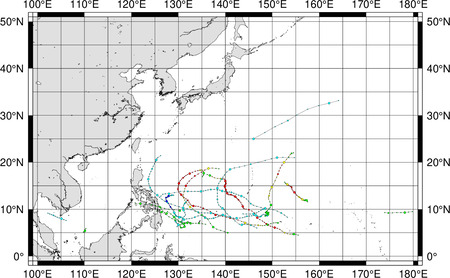
| 3月 |
4月 |
 |
 |
|
新しい台風シーズンの始まりですが、まだまだ発生数も少なく、台風が日本に近づくこともありません。
|
ほとんどの台風はフィリピン方面に進みますが、沖縄に近づくこともまれにあります。
|
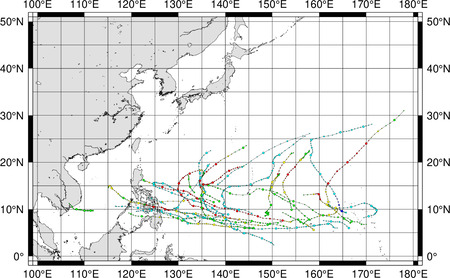
| 5月 |
6月 |
 |
 |
|
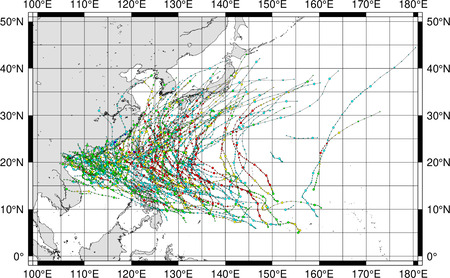
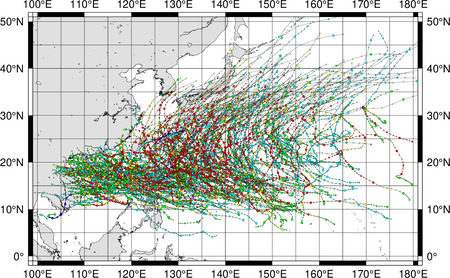
沖縄や小笠原では早くも台風シーズンが始まります。太平洋上では、少しずつ強い台風が生まれるようになります。
|
台風発生数も増えてきます。強い台風が生まれるのは、まだはるか南の海ですが、日本列島に接近する台風は徐々に増えてきます。
|
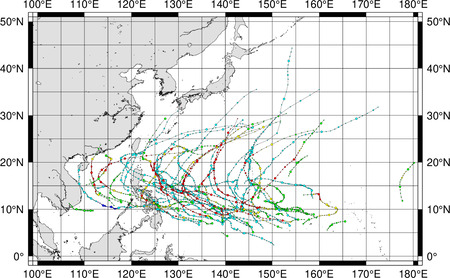
| 7月 |
8月 |
 |
 |
|
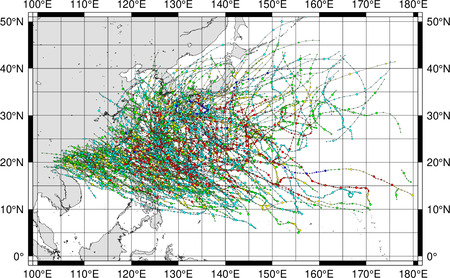
本格的な台風シーズンに入ります。特に梅雨前線が活発な時に強い台風が接近すると、豪雨になりやすいので注意が必要です。
|
強い台風が日本列島に接近するようになり、特に後半は危険な時期に入ります。また海では土用波にも注意が必要です。
|
| 9月 |
10月 |
 |
 |
|
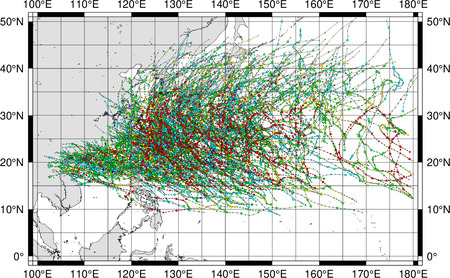
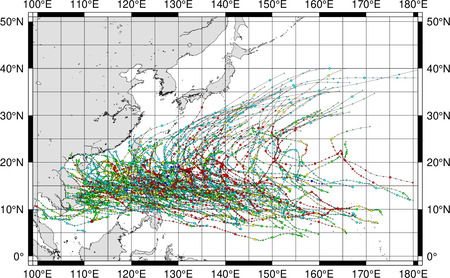
台風がもっとも危険な時期です。この時期は台風が発達しやすく、日本列島にも接近しやすいため、風雨による大規模災害の発生も多くなるのです。
|
台風が北に向かうことは次第に少なくなりますが、強い台風が日本列島に接近することもありますので、まだ油断はできません。
|
| 11月 |
12月 |
 |
 |
|
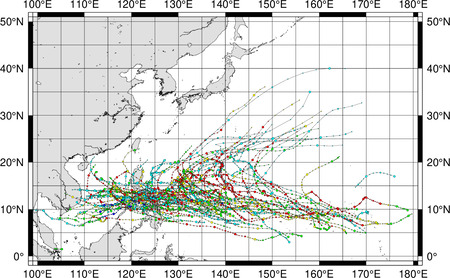
南の海では強い台風も生まれますが、小笠原や伊豆諸島南部以外では接近する台風も少なくなり、そろそろ台風シーズンも終わりです。
|
日本はすでに冬になっています。ほとんどの台風は太平洋上を東から西に進み、北に進むことはほとんどありません。
|