| ||||||||||
| ||||||||||
|
ほぼすべての台風には名前があります。日本では、台風をシーズンごとに始まる番号(台風14号や台風0314号など)で呼ぶのが普通ですが、世界的にはむしろ、台風(ハリケーン/サイクロン)を名前で呼ぶ方式が広まっています。日本でも、戦後すぐには米国風の名前が使われた時期もありましたが、日本国内向けの台風情報に関してはその後は番号で呼ぶ方式が定着しました。ただし「台風に名前をつける」という習慣は、国際的な台風情報に関しては今も続いています。2000年までは欧米風の名前が使われていましたが、2000年以後はアジアの名前が使われるようになりました。以下に台風の名前のリストを示します。
台風によって顕著な災害が引き起こされたり、台風に伴って顕著な現象が観測された場合(顕著異常現象)、気象庁が台風に特別な名前を命名する制度があります。過去の台風の中で、このように命名された顕著台風は、以下の8個です。なお以下では最初の命名台風は「洞爺丸台風」となっていますが、実際には「洞爺丸台風」はその時点で命名されたわけではなく、「狩野川台風」が命名された時に、さかのぼって命名されました。したがってこの制度が始まったのは1958年ということになります。
日本海を高速に進み温帯低気圧化する過程で発達するという典型的な風台風の経過をたどり、東北〜北海道に吹いた暴風により青函連絡船・洞爺丸が沈没するという大事故が発生した。 [リソース]
東海地方と関東地方に降った大量の降水により、浸水家屋が52万以上という過去最大の水害となり、特に伊豆半島中部の狩野川流域の被害が甚大だった。 [リソース]
宮古島で記録した最低気圧908.4hPaにより宮古島台風と呼ばれ、宮古島での損害は壊滅的なものとなった。 [リソース]
伊勢湾で発生した史上最大級の高潮によって、死者・行方不明者は5000人を越えて過去最大、日本のその後の防災対策を決定付けた台風でもある。 [リソース]
室戸岬では84.5m/s以上の最大瞬間風速を記録し、関西各地に暴風・高潮被害を引き起こした。 [リソース]
宮古島では最大風速60.8m/s、最大瞬間風速85.3m/sを記録し、これは現在でも日本の観測史上1位の記録である。 [リソース]
宮古島では最大風速54.3m/s、最大瞬間風速79.8m/sを記録し、宮古島に再び甚大な被害を残した。 [リソース]
沖永良部島で最低海面気圧907.3hPaを記録した。 [リソース]
房総半島を中心とした各地で暴風等による被害。台風「ファクサイ」。 [リソース]
東日本の広い範囲における記録的な大雨により大河川を含む多数の河川氾濫等による被害。台風「ハギビス」。 [リソース]
正式に命名されてはいませんが、話題となることが多い台風のリストです。なおこれらの台風についても、国際名としての正式な台風の名前は存在します。
単独の台風としては史上最大の降水量834億トンを記録し、全国で同時多発的な水害を引き起こした。 [リソース]
太平洋上で海面気圧の世界最低記録870hPaを記録した、観測史上最強の台風(*1)。日本上陸後にも死者不明100人以上の大きな被害を残した。 [リソース]
青森県におけるリンゴ農園被害の印象が強いため、「りんご台風」と呼ばれることが多い。また支払保険金も約5679億円と日本で過去最高の金額に達した。 [リソース]
(*1) 日本を襲った強力な台風としては昭和の三大台風が有名ですが、三大台風の比較によると、日本(本土)上陸時では室戸台風が史上最大の勢力をもった台風ということになるようです。これらに比べると、日本上陸時の台風197920号はそれほど強いものではありません。
デジタル台風では、さまざまな台風のランキングを提供しており、トップページの「メタデータによる検索」から調べることができます。以下にはいくつかのランキングを示します。
以下のページでは、さらに詳しい情報を提供しています。
北西太平洋での台風発生数の統計を示します。二つのグラフは、1月1日から12月31日までの累計発生個数、およびそれぞれの日における平均存在個数を示しています。累計発生個数を見ると、1シーズンに発生する台風の個数は平均して27個弱であることがわかります。一方で平均存在個数を見ると、2月中旬でほぼゼロに近い最小値となっており、この期間は台風がほとんど存在しない期間であることがわかります。したがって台風シーズンの切れ目はこの時期にあると言え、実質的には2月中旬から新しい台風シーズンが始まることになります。
なお同時に多数の台風が存在した事例として有名なのが「五輪台風」と呼ばれるもので、同時に5個の台風が存在したことから、その年(1960)に開催されたローマオリンピックにちなんでそのように呼ばれました。
なお厳密に調べてみると、1960年のローマオリンピックは1960年8月25日から1960年9月11日まで、5個の台風が発生していたのが1960年8月23日06:00UTCから1960年8月24日00:00UTCの15時間ですので、両者の期間は重なってはいないようです。
また熱帯低気圧活動カレンダー(存在個数)を見ると、日本時間(JST)で見た場合、1960年に加えて1985年の9月1日にも台風は5個存在したことがわかります。ただこの日は台風の発生と消滅が連続しており、同時刻の存在個数としては4個が最大となっています。
なお台風がどのくらいの期間連続して発生していたか、またどのくらいの期間発生しなかったかについては、以下のページをご覧下さい。
いろいろな条件を指定して、過去の台風経路図を描くことができます。過去の台風のコースを知りたい際には以下のページで検索して下さい。なお台風経路図の詳細につきましては、「台風系列検索による台風経路図」を参照して下さい。
台風の中には複雑な経路を進むものがあります。迷走台風とも呼ばれるこのような台風は、どのように誕生するのでしょうか?
そもそも台風は「自走」できるのでしょうかといえば、自走できなくはないけれども、そのスピードは非常にゆっくりで、しかも北半球では西北西にしか進めないという制限があります。つまり台風はほとんど自走できないと思った方がよい。では何が台風を動かしているのかといえば、上空の大気の流れです。大気の流れが強ければ台風は迷わずに典型的なコースを進みますし、大気の流れが弱く時間とともにコロコロ変わる場合は迷走しがちになります。そして行先に大きな高気圧がドッシリと動かずに居座っているような場合は、進行方向を反転させたりもします。
日本付近の上空の大気の流れは、春や秋であれば偏西風がガッチリと支配していますので、その季節に台風が迷うことはあまりありません。したがって迷走台風が多いのは夏ということになります。以下には複雑な経路を記録した台風のリストを集めました。
中心の距離が1000km程度以内の複数の台風が、相互作用を及ぼして複雑な動きを示すことがあります。このような台風の相互作用(干渉)を「藤原効果」と呼びます。気象庁では「藤原の効果」を、「2つ以上の台風が接近して存在する場合に、台風がそれらの中間のある点のまわりで相対的に低気圧性の回転運動をすること」と定義しています。以下は複数の台風が接近して存在した過去の例ですが、すべてのケースが「藤原の効果」によるものと断定はできないことに注意して下さい。
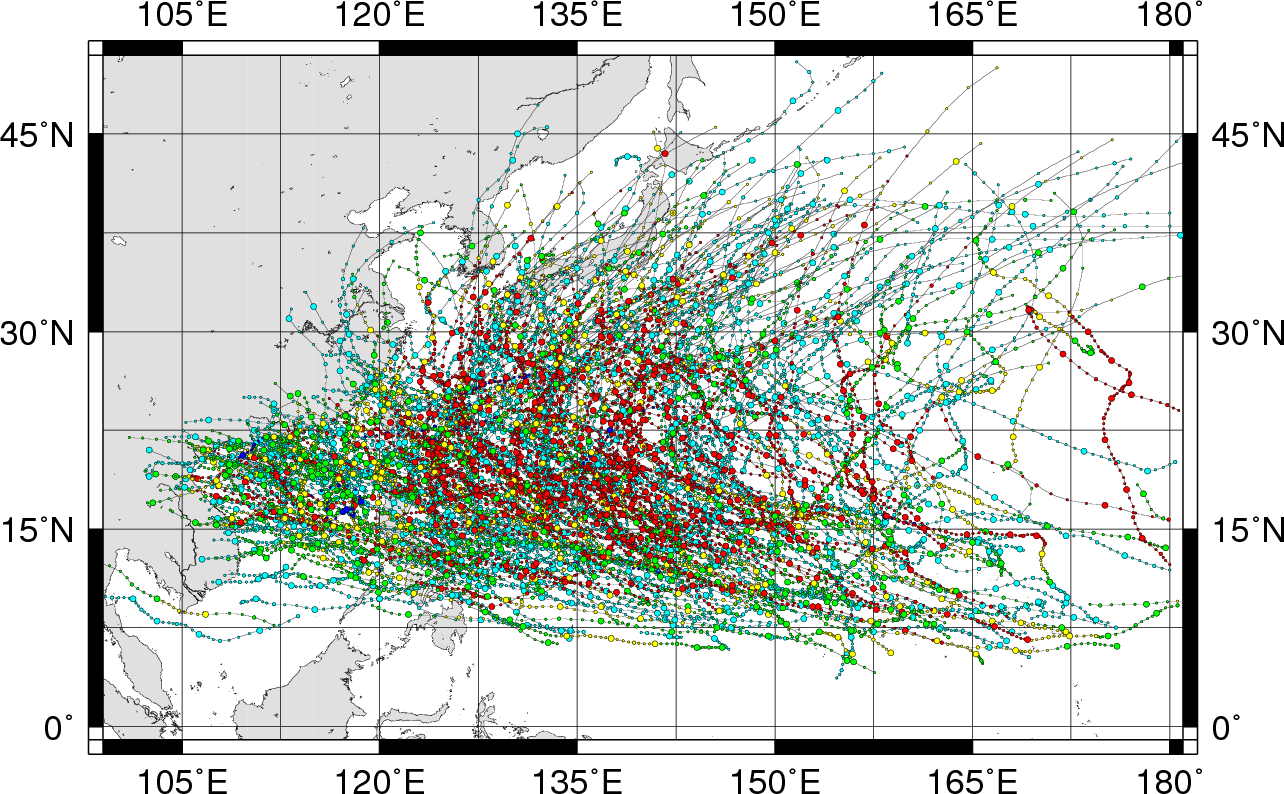
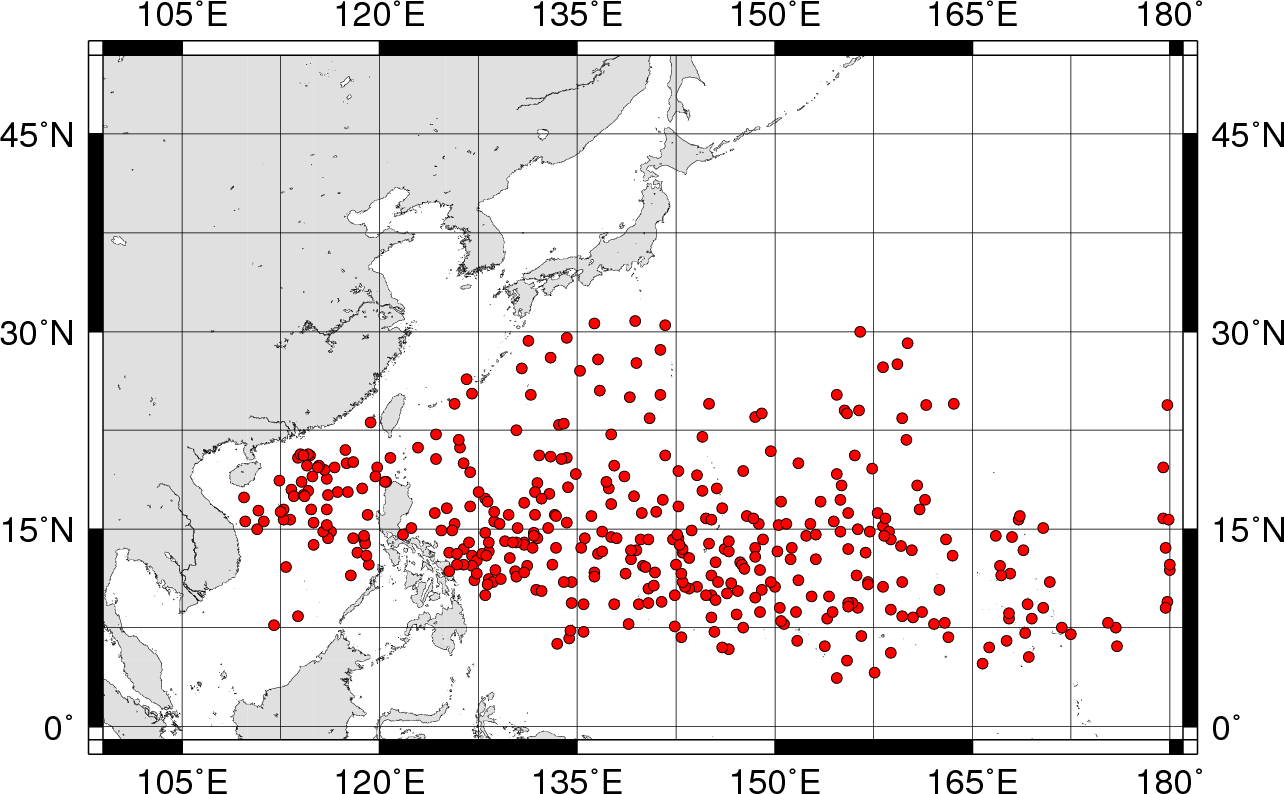
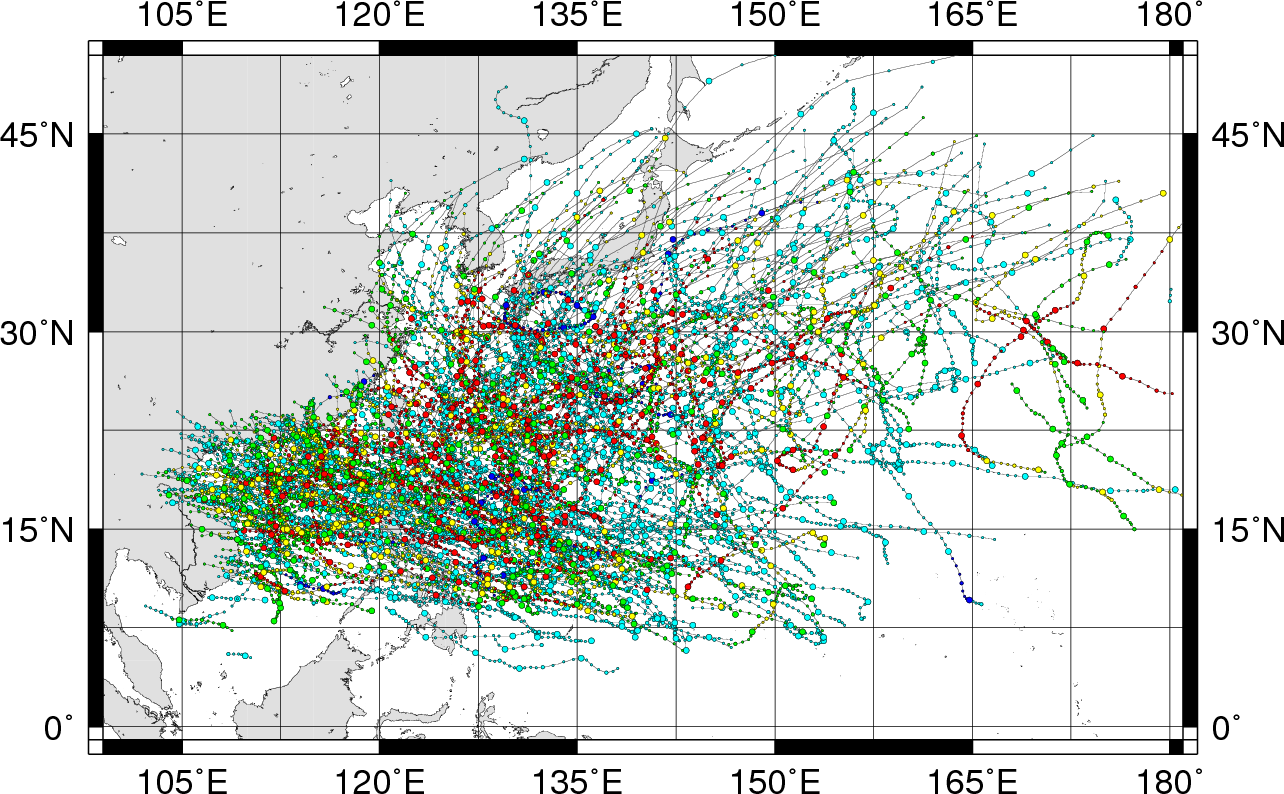
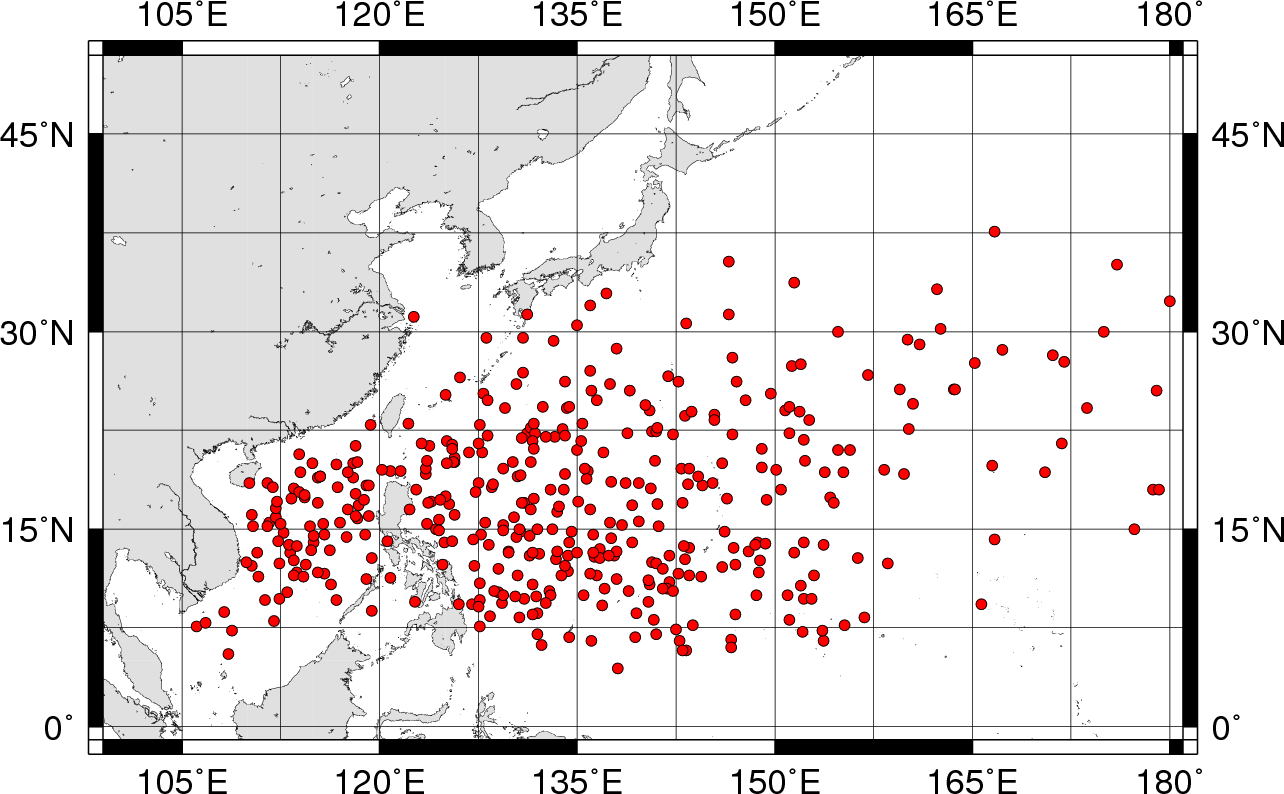
エルニーニョ現象とは、太平洋赤道域の中央部(日付変更線付近)から南米のペルー沿岸にかけての広い海域で、海面水温が平年に比べて高くなり、その状態が1年ほど続く現象です。ラニーニャ現象とは、エルニーニョ現象とは逆に、同じ海域で海面水温が平年より低い状態が続く現象です。以下では気象庁のエルニーニョ/ラニーニャ現象を参照し、台風の発生日がエルニーニョ/ラニーニャ現象の発生期間に含まれる台風を検索することができます。なお発生期間は季節単位(3ヶ月単位)で定められており、この季節を考慮しています。
以下の図は、エルニーニョ現象/ラニーニャ現象中の台風発生位置を表示したものです。同じものは、上記のリンクをクリックし、「台風発生地点図」をクリックすれば作成できるものです。
詳しい情報、および最新情報は、気象庁のエルニーニョ/ラニーニャ現象のページで確認して下さい。
台風の予報精度として、予報円との関係を分析しました。
|