1. Clustering
Clustering procedures aim at yielding a data description in terms of
clusters or groups of data points that possess strong internal
similarities. For the typhoon image collection, we expect that
clustering procedures may produce the intuitive summarization of
typhoon cloud patterns that can be used as the catalog of typhoon
images. If we can find a set of clusters that represent typical
patterns of the typhoon, we can categorize complex cloud patterns into
several representative patterns, thereby characterize them with a set
of basic patterns. The Dvorak method, the standard typhoon analysis
method in the meteorology community, did this task manually and
selected typical cloud patterns embodied from the long experience of
analysts. In contrast, we do this task automatically.
:: Search the Typhoon Image Database (www.digital-typhoon.org) ::
K-means clustering
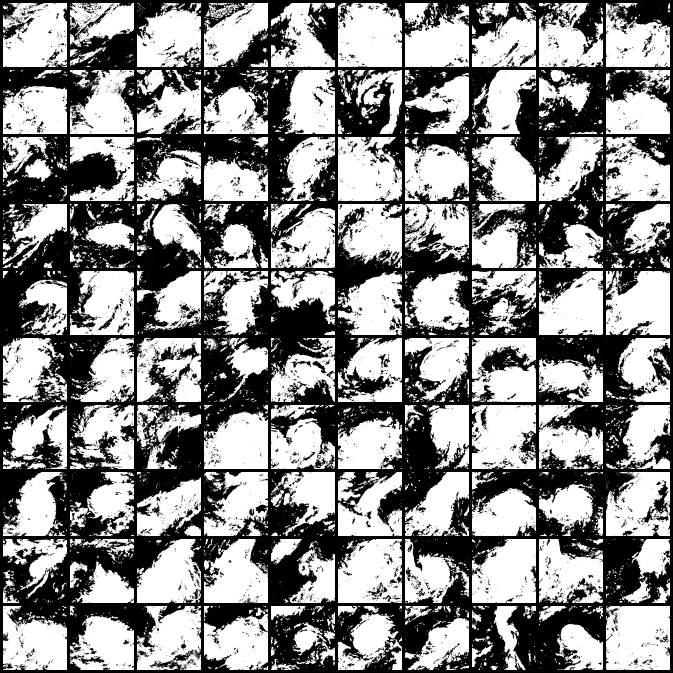 The basic non-hierarchical clustering procedure is the K-means
clustering. Those images can be considered as representative
patterns, and many types of shape are visualized together on a two
dimensional space. Hence it is a concise visualization, but it is
still not an intuitive visualization for humans due to the lack of
ordering between clusters.
The basic non-hierarchical clustering procedure is the K-means
clustering. Those images can be considered as representative
patterns, and many types of shape are visualized together on a two
dimensional space. Hence it is a concise visualization, but it is
still not an intuitive visualization for humans due to the lack of
ordering between clusters.
Self-Organizing Map
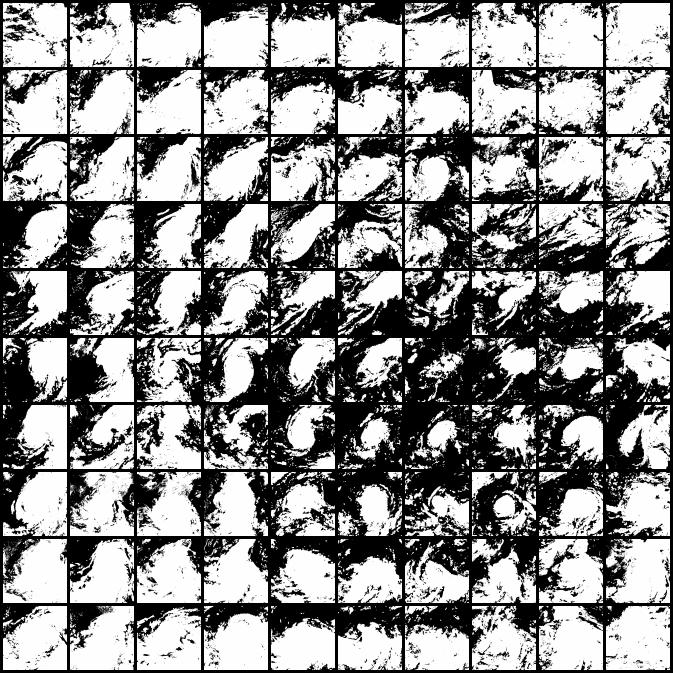
 Self-Organizing Map (SOM) summarizes high dimensional data vectors
with a set of reference vectors having a topological organization on a
(usually) two-dimensional lattice. They give an improved
visualization with apparent spatial ordering. These clustering methods
can thus visualize the high dimensional feature space of typhoon cloud
patterns in a ``birds-eye-view'' representation, which is effective
for understanding the overall distribution at a glance. Thus the
ordering of typhoon cloud patterns attained by the SOM gives a unique
insight into the nature of typhoon cloud patterns.
Self-Organizing Map (SOM) summarizes high dimensional data vectors
with a set of reference vectors having a topological organization on a
(usually) two-dimensional lattice. They give an improved
visualization with apparent spatial ordering. These clustering methods
can thus visualize the high dimensional feature space of typhoon cloud
patterns in a ``birds-eye-view'' representation, which is effective
for understanding the overall distribution at a glance. Thus the
ordering of typhoon cloud patterns attained by the SOM gives a unique
insight into the nature of typhoon cloud patterns.