| ||||||||||||
| ||||||||||||
|
| | | | | | | | | | | | |
:: Search the Typhoon Image Database (www.digital-typhoon.org) ::
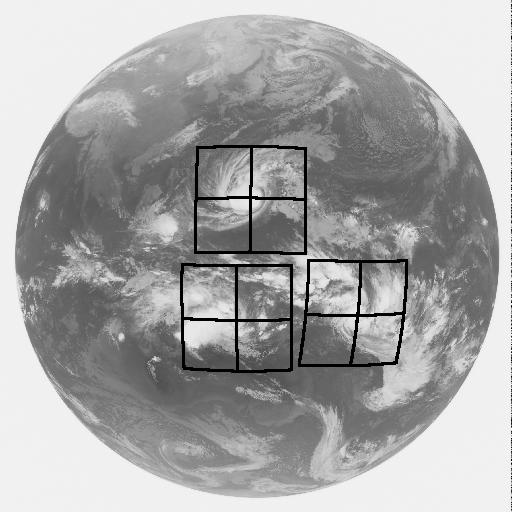
The satellite image from GMS satellite captured three typhoons simultaneously, one in the northern hemisphere and two in the southern hemisphere. The center of those typhoons is determined from "Best Track", and then a region around the center is map projected (Lambert Azimuthal Equal-Area Projection). This makes what we call a "typhoon image" which is centered on the image with the correct area. The size of the typhoon image is usually 2600km width for both sides.
| 9626 (Northern) | 0860 (Southern) |
|---|---|
|
|
(Note) The latest statistics are summarized in the Digital Typhoon page.
| As of Jan. 2004 | Northern Hemisphere | Southern Hemisphere |
|---|---|---|
| Best track provider | Japan Meteorological Agency | Australian Bureau of Meteorology |
| Latitude Area of Reponsibility | North of Equator | South of Equator |
| Longitude Area of Reponsibility | 100 E -- 180 E | 90 E -- 170 E |
| Number of typhoon seasons | 26 | 25 |
| Number of typhoon sequence | 666 | 269 |
| Number of typhoon images | 107,600 | 30,300 |
| Number of typhoon images per sequence | 53 -- 433 | 25 -- 513 |
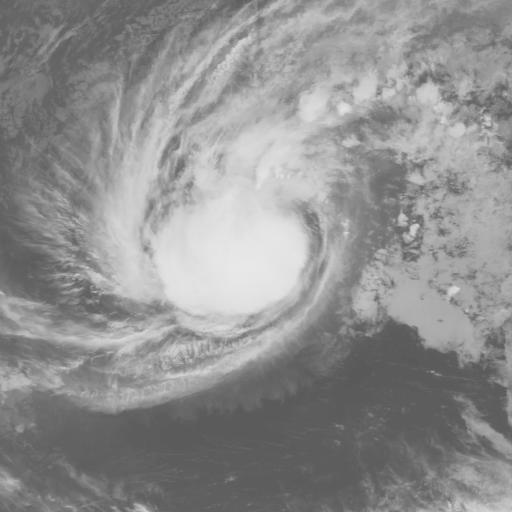
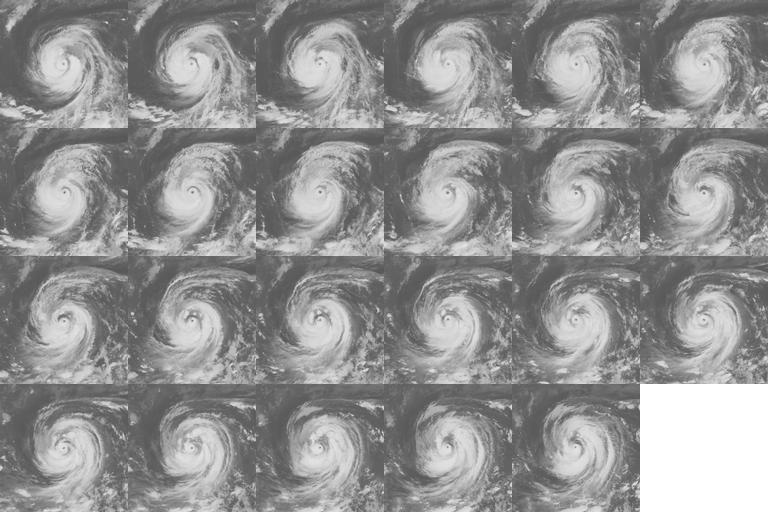 The image below illustrates the collection of images taken on August
15, 1997 for Typhoon 199713. Adjacent images only differ in one hour,
and they show pattern change in one hour is not significant.
The image below illustrates the collection of images taken on August
15, 1997 for Typhoon 199713. Adjacent images only differ in one hour,
and they show pattern change in one hour is not significant.
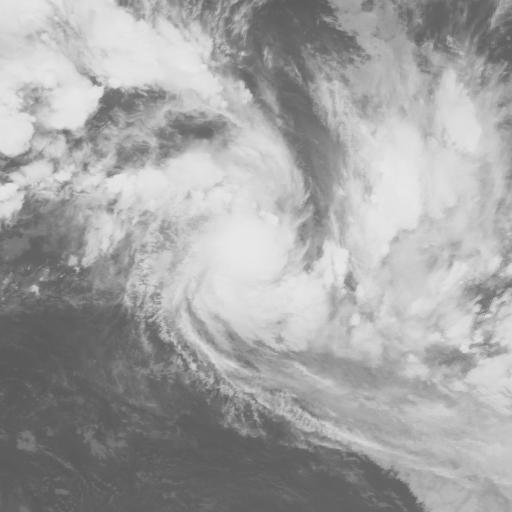
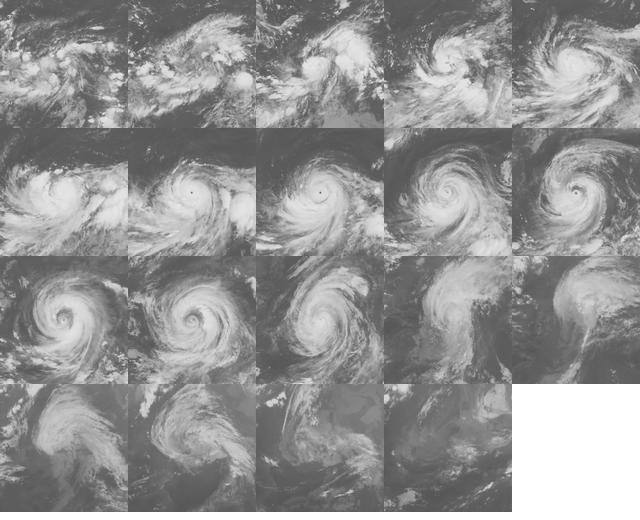 The image below illustrates pattern change of the same one, Typhoon
199713, but in different time scale, sampling every one
day. Accumulation of a slight change in one hour makes significant
change in one day.
The image below illustrates pattern change of the same one, Typhoon
199713, but in different time scale, sampling every one
day. Accumulation of a slight change in one hour makes significant
change in one day.
:: Search the Typhoon Image Database (www.digital-typhoon.org) ::
|