1. 概要
データから抽出した情報に関する理解を視覚的に向上させるための画像生成技術には、大別すると2つのテーマがある。第一にscientific visualization、すなわち科学的データの可視化であり、これは現象の何らかの側面を分析しやすくするために色などの要素を効果的に使う手法であり、コンピュータグラフィクスとも関連が深い。第二にinformation visualization、すなわち情報の可視化であり、特に大規模データのように数字や文字を見るだけでは構造を把握しにくいデータを、目に見える形に変換して表示するものであり、情報デザインなどとも関連が深い。ここではscientific visualizationに関する話題を紹介する。
2. ボリュームレンダリングを用いた気象衛星画像の3次元可視化
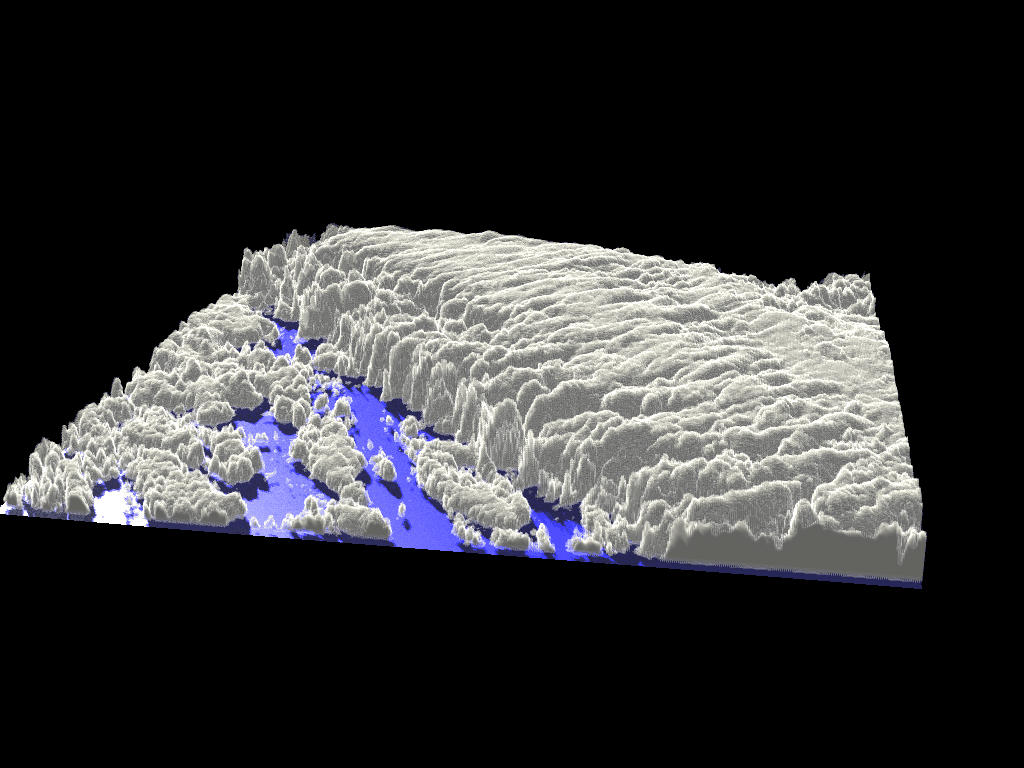
 まず可視化の一例として、気象衛星雲画像をコンピュータグラフィックスの技術を用いて3次元的に可視化し、衛星画像を多様な視点からユーザに提示するための方法を紹介する。気象衛星画像を3次元的に見せることによる利点は、雲表面の細かい陰影によって雲の構造がより明確に浮き出ることにあり、さらにこれら生成画像を時系列的に提示することによって、雲の生成過程のダイナミクスもより直観的に見えることになる。本プロジェクトの実験対象は、気象衛星NOAAの赤外画像と気象衛星GMS (ひまわり) の赤外画像であり、用いる手法はボリュームレンダリングである。
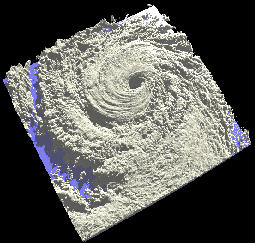
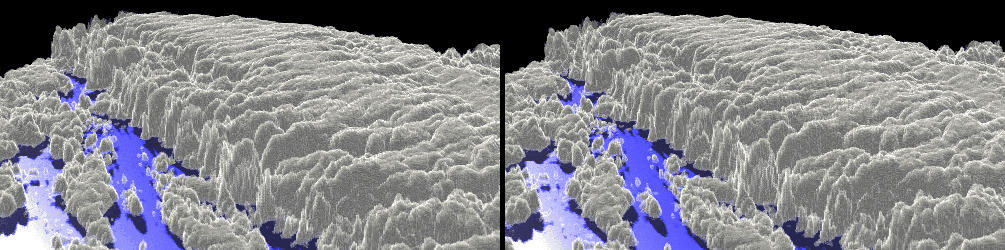
台風9605号の動き (1996年7月3日〜1996年7月9日)、ひまわり画像
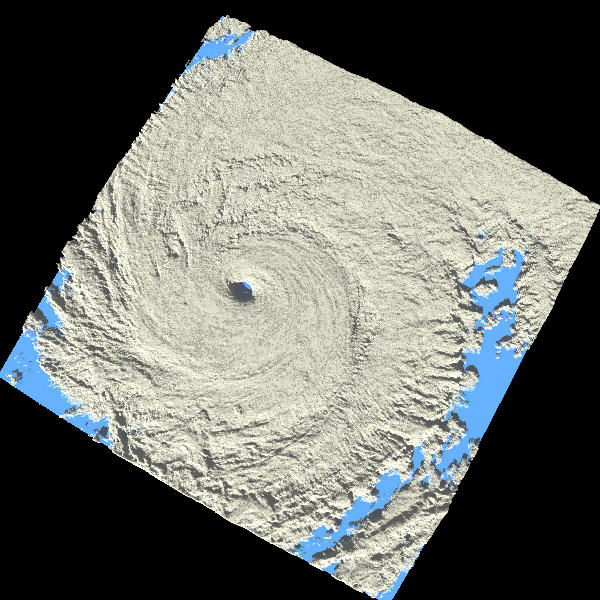
台風9512号の3D画像 (1995年9月16日)、NOAA画像
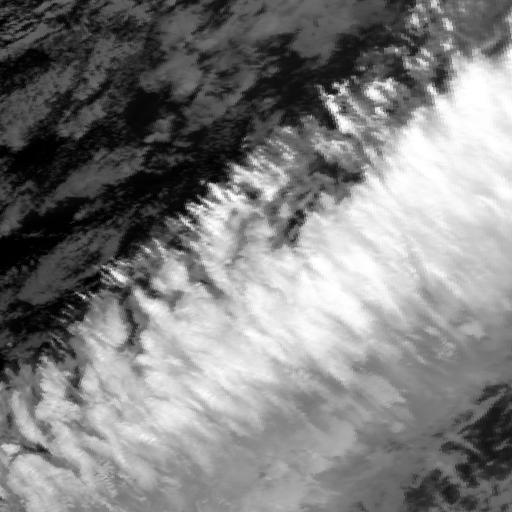
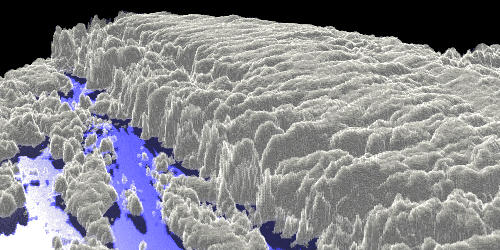
その他の画像例、NOAA画像
3. 関連するトピック
フラクタル
フラクタルは、コンピュータグラフィックスの手法の一つとして、「美しい画像」を生成するために便利な手法として有名であるが、画像解析の観点からは自然物の画像特徴量としても重要な役割を果たすことが知られている。また「雲はフラクタルである」との仮説のもとに、フラクタルのアルゴリズムを用いた雲の生成アルゴリズムも知られており、もしこれらのアルゴリズムによって、雲を忠実に再現した画像を生成できれば、同種の画像を「生成」と「解析」という二つの立場から眺めることができるようになる。これは Analysis by Synthesis という研究の方向を推進するためには、大きなステップである。このページの背景は、非整数ブラウン運動(fractional Brownian motion)の生成アルゴリズムを用いた、フラクタル画像となっている。
4. 関連するデモンストレーション
5.
参考文献(全リスト)
-
北本 朝展, 高木 幹雄,
"ボリュームレンダリングを用いた気象衛星画像の3次元可視化",
テレビジョン学会年次大会,
pp. 114-115, doi:10.11485/tvac.32.0_114,
1996年7月
[
概要
]
[
Paper
]
6.
関連リンク